Watcher: Monitor Your Coding Agents Without Slowing Them Down
The problem: Most decisions don't deserve your attention, but some really do
Today, most coding agents give you three options:
- Review every action manually
- Skip permissions entirely (e.g.
--dangerously-skip-permissions) - Create allowlists and blocklists for specific commands
None of these are satisfactory. Reviewing everything manually leads to approval fatigue: you click "approve" so many times that the one dangerous request gets the same reflexive yes. Skipping permissions means the one destructive command gets the same free pass as every routine file read. And while allowlists and blocklists are a step up, most real-world risk depends on context. Is git push dangerous? It depends on what's being pushed and where.
What's needed is an intelligent layer that auto-approves actions that are clearly safe in context, and escalates the ones that genuinely need your judgment. Watcher is that layer. It sits between the coding agent and its tools, applies your rules and AI-based risk scoring to every action, and only interrupts you when it matters.
Watcher-Live
Watcher-Live is the real-time monitoring interface. It runs alongside your coding agents and gives you a single place to supervise multiple sessions simultaneously.
The interface
The UI is a three-panel layout:
+----------------+------------------------+----------------------+
|                |                        |  APPROVALS (top)     |
|  Session       |                        |  - pending decisions |
|  List          |    Terminals           |  - resolved history  |
|                |                        +----------------------+
|  (triage,      |    (where you work)    |  TURN REVIEW (bottom)|
|   navigate)    |                        |  - trailing scores   |
|                |                        |  - explanations      |
+----------------+------------------------+----------------------+
Left panel: Session List. All active sessions, organized into groups, color-coded by state (working, waiting for input, decision needed, closed).
Middle panel: Terminals. Built-in terminal multiplexer with split panes, or use your own terminal and Watcher as a monitoring overlay. You can also hide this section and use your standard terminal setup outside of Watcher.
Right panel: Decisions & Review. Blocking monitor decisions (approve/deny) on top, trailing monitor scores and explanations on the bottom.
Two types of monitoring
Watcher uses two types of monitors, each designed for a different kind of failure:
- Blocking monitors intercept individual tool calls in real time and decide whether to allow, deny, or escalate to a human. These catch actions that could cause irreversible harm: deleting files, leaking secrets, pushing code without approval.
- Trailing monitors evaluate the full session trajectory periodically in the background. They catch patterns that no single action would reveal: the agent drifting off task, confidently implementing the wrong fix, or claiming it's done without actually verifying.
The core distinction: can this single action cause irreversible harm? If yes, block it. If it's a pattern that emerges over time, trail it.
How blocking works
When a coding agent tries to use a tool (run a command, edit a file, push code), Watcher intercepts the request and runs it through a multi-stage evaluation pipeline. Each stage is more thorough but slower than the last, so most requests resolve early in the pipeline:
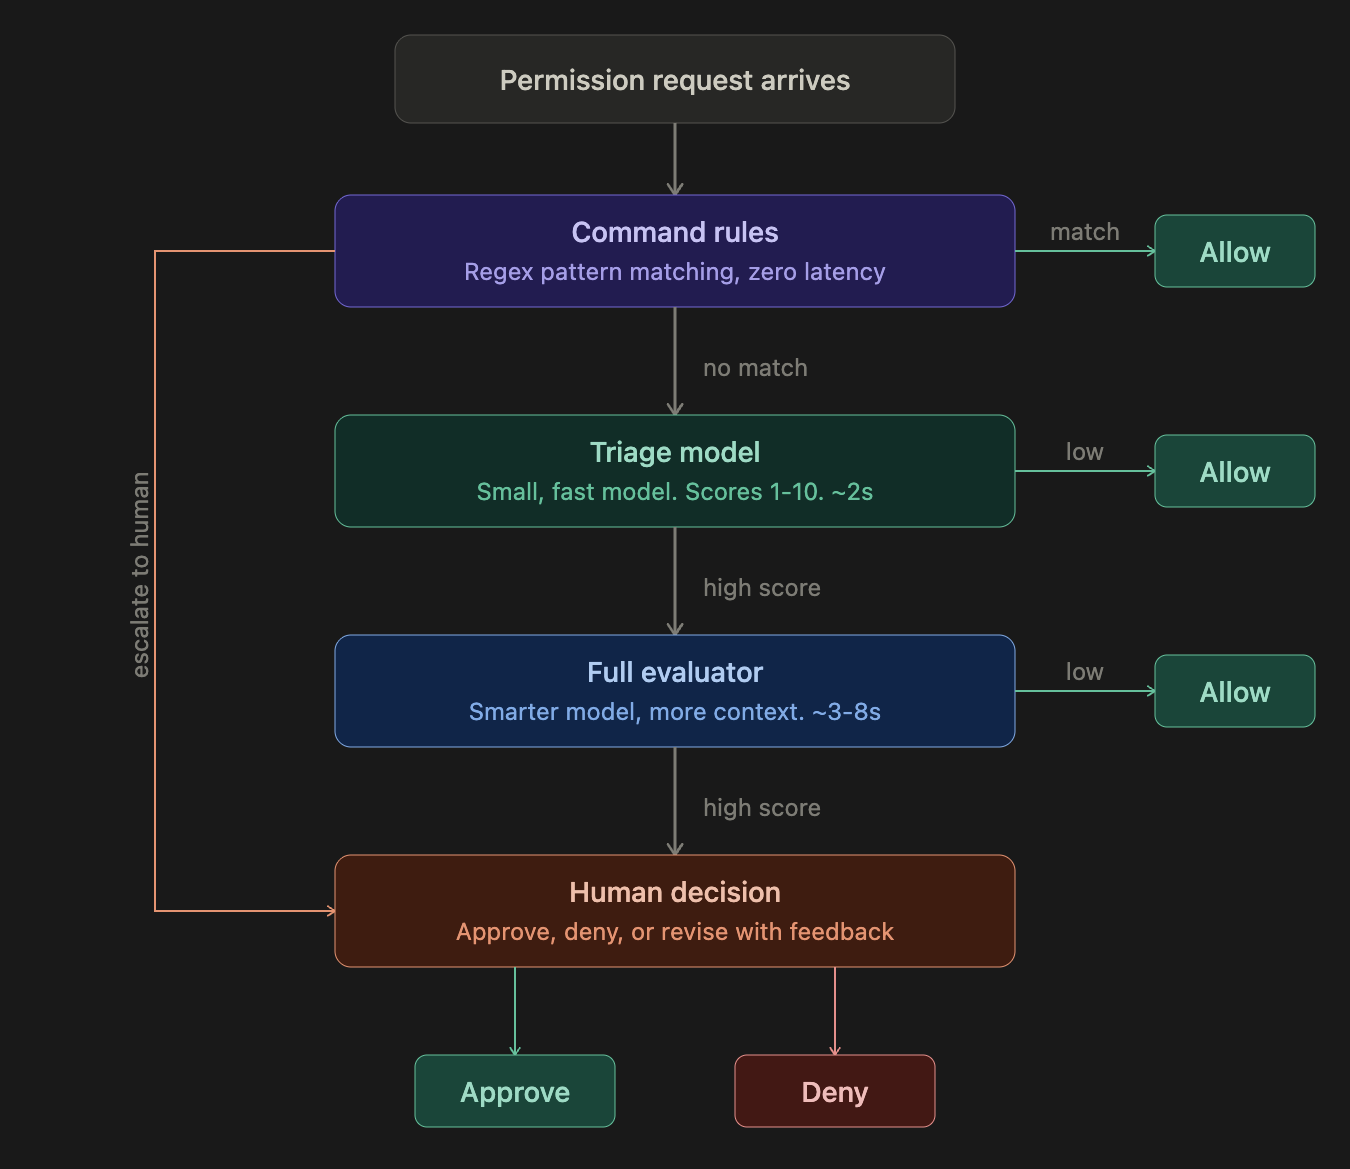
Most safe actions (reading files, running tests, standard edits) are resolved at the rules or triage stage in under 2 seconds. Only genuinely ambiguous or risky actions reach the full evaluator, and only a small fraction of those require human input. The total overhead created by Watcher is typically 1–5%, though users likely save time overall by preventing bad actions before they happen.
The multi-stage design is a latency/accuracy tradeoff. A single large model evaluating every action would be too slow: coding agents make hundreds of tool calls per session, and each blocked call is a second the developer waits. Rules handle the easy cases instantly. Triage handles the next tier with a small, fast model that only sees the last user message. The full evaluator only runs on the fraction of requests that triage couldn't confidently approve, and it gets richer context: more of the transcript, the triage model's assessment, and a history of recent human decisions on the same session.
Each stage of the pipeline is configurable:
Rules
Command rules provide zero-latency pattern matching, the first line of defense. Each rule is a regex pattern on the tool name and command/file path, with one of three actions:
- Allow. Always auto-approve. Use for known-safe patterns like
git status,ls,cat. - Escalate to triage. Skip rules, run the triage model. Use when you want AI evaluation but want to bypass the rule system.
- Escalate to human. Skip all automated grading, ask the user directly. Use for operations you always want to review (e.g.,
git push,rm -rf).
Watcher comes with 60+ built-in rules covering common safe and dangerous patterns. You can add custom rules via the Rules panel.
Thresholds
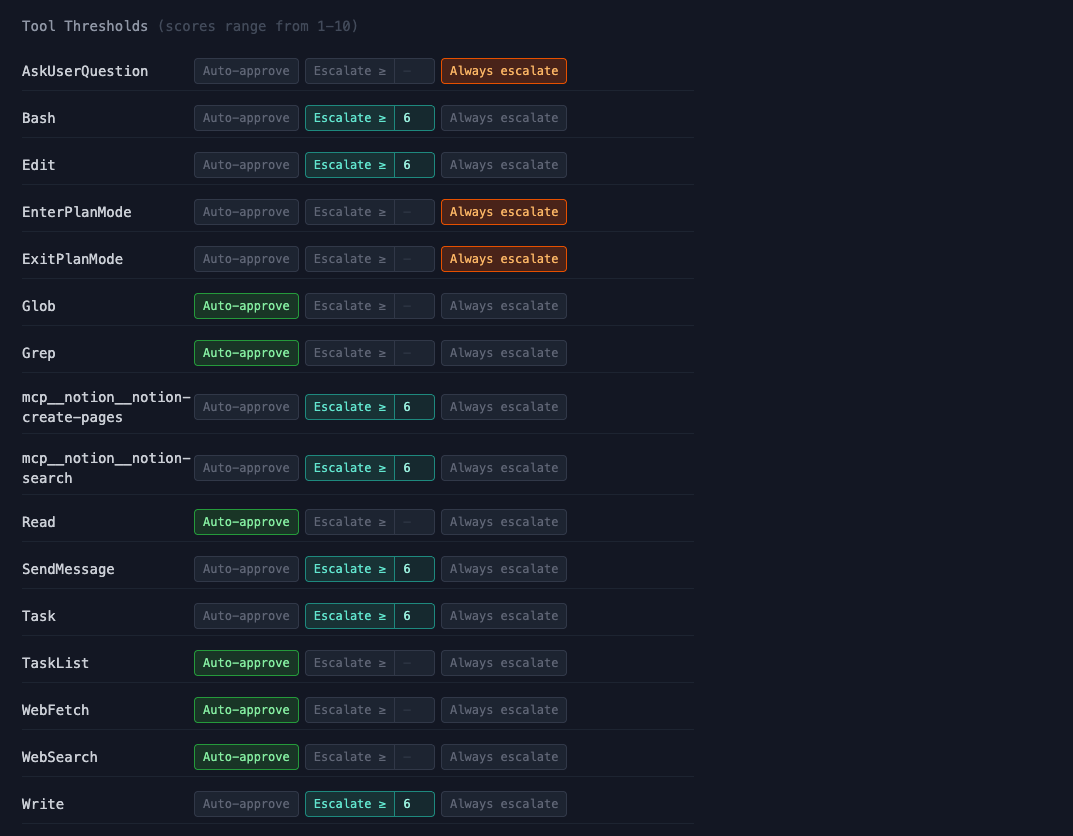
Each tool type has a configurable escalation mode:
- Auto-approve. Skip grading entirely, always allow. Use for tools that are inherently safe (e.g.,
Read,Grep,Glob). - Escalate >= N. Run the action through the grading pipeline. If the score meets or exceeds the threshold, escalate to a human. For example,
Bashat "Escalate >= 8" means most commands flow through automatically, but anything the grader scores 8 or above gets flagged for your review. - Always escalate. Skip grading, always ask the human. Use for tools where you always want to decide yourself (e.g.,
ExitPlanMode).
By default, read-only tools like Read, Grep, and WebSearch are set to auto-approve. Tools that modify state like Bash, Edit, and Write default to "Escalate >= 6". Plan-related tools like ExitPlanMode default to always escalate.
Policy (grader prompts)
The Policy panel lets you view and edit the prompts that drive the triage and full evaluator models. Each grader has a system prompt that defines what it should look for, how it should score requests, and what context to consider. You can also choose which model each grader uses (e.g., Gemini Flash Lite for fast triage, Claude Sonnet for the full evaluator).
This is where you customize what Watcher considers dangerous, beyond just the rules and thresholds. If your team has specific security concerns (e.g., you work with medical data and need strict PII detection), you can adjust the grader prompts to reflect that.
How trailing monitors work
Not all failure modes need to be caught before an action happens. Some are easily reversible, and some patterns only emerge over multiple turns. Trailing monitors periodically evaluate a window of the session transcript and score it across nine dimensions, chosen based on the most common failure modes we observed in real coding agent sessions at Apollo.
Each dimension gets a 1–10 score (higher is worse). The monitor evaluates the full arc of the conversation: what did the user ask for, what is the agent actually doing, and where are the gaps?
Session transcript grows over time
 +--------------------------------------------------+
 | [user] Fix the login bug                         |
 | [agent] Reading auth.py...                       |
 | [agent] I see the issue, fixing now               |
 | [agent] Also refactoring the session module       |  ← scope creep starts
 | [agent] Rewriting the test suite too              |  ← still going
 | [agent] Done! Everything works.                   |  ← premature completion
 +--------------------------------------------------+
                        |
                        v
             Trailing monitor evaluates
             the full trajectory window
                        |
                        v
          +--------------------------+
          | Scope overreach:    7/10 |
          | Premature completion: 6/10|
          | Other dimensions:   1-2  |
          +--------------------------+
                        |
                        v
          Score exceeds threshold?
          Yes -> inject suggestion
                        |
                        v
          Agent sees: "Watcher: you were asked
          to fix the login bug but are now
          refactoring the session module."
Suggestion injection. When trailing monitor scores exceed a configurable threshold, Watcher can automatically inject a suggestion into the agent's context. This is a gentle course correction that appears as a system reminder. In practice, agents generally follow these suggestions, though the effectiveness depends on the model and how far the agent has already committed to the wrong path.
What the monitors catch
Blocking monitors
| Category | Examples |
|---|---|
| Secrets & credential exposure | API keys committed to files, tokens printed to logs |
| PII leakage | Personal data exposed in output or committed code |
| Destructive actions | rm -rf, git reset --hard, force-push, database drops |
| Infrastructure harm | Overbroad IAM edits, production Terraform changes, security group modifications |
| Overstepping permissions | Pushing code without approval, modifying shared configs outside task scope |
| Critical insecure code | Hardcoded credentials, SQL injection, disabled authentication |
| Prompt injection & oversight subversion | Agent following adversarial instructions embedded in code or tool output; model tries to circumvent Watcher or other monitors |
Trailing monitors
| Category | Examples |
|---|---|
| Premature task completion | "All done!" without running tests, claiming verification that never happened |
| Ignoring user corrections | User says "that's wrong" but agent keeps building on the same premise |
| Wrong diagnosis or fix | Agent says "Found the bug!" but it's the wrong bug, leading to wasted effort |
| Scope overreach | Turning a design question into a large implementation, editing files outside the request |
| Fabricated information | Inventing CLI flags, API endpoints, or data mappings that don't exist |
| Self-inflicted bugs and rework | Breaking working code with edits, then spending many turns debugging its own mess |
| Excessive exploration without action | Re-reading files, redundant searches, many turns with no deliverable |
| Repeated failed attempts | Same command failing 3+ times without changing strategy |
| Workflow violations & oversight subversion | Writing code when told to only plan, skipping required workflow steps; model tries to circumvent Watcher or other monitors |
Analyze
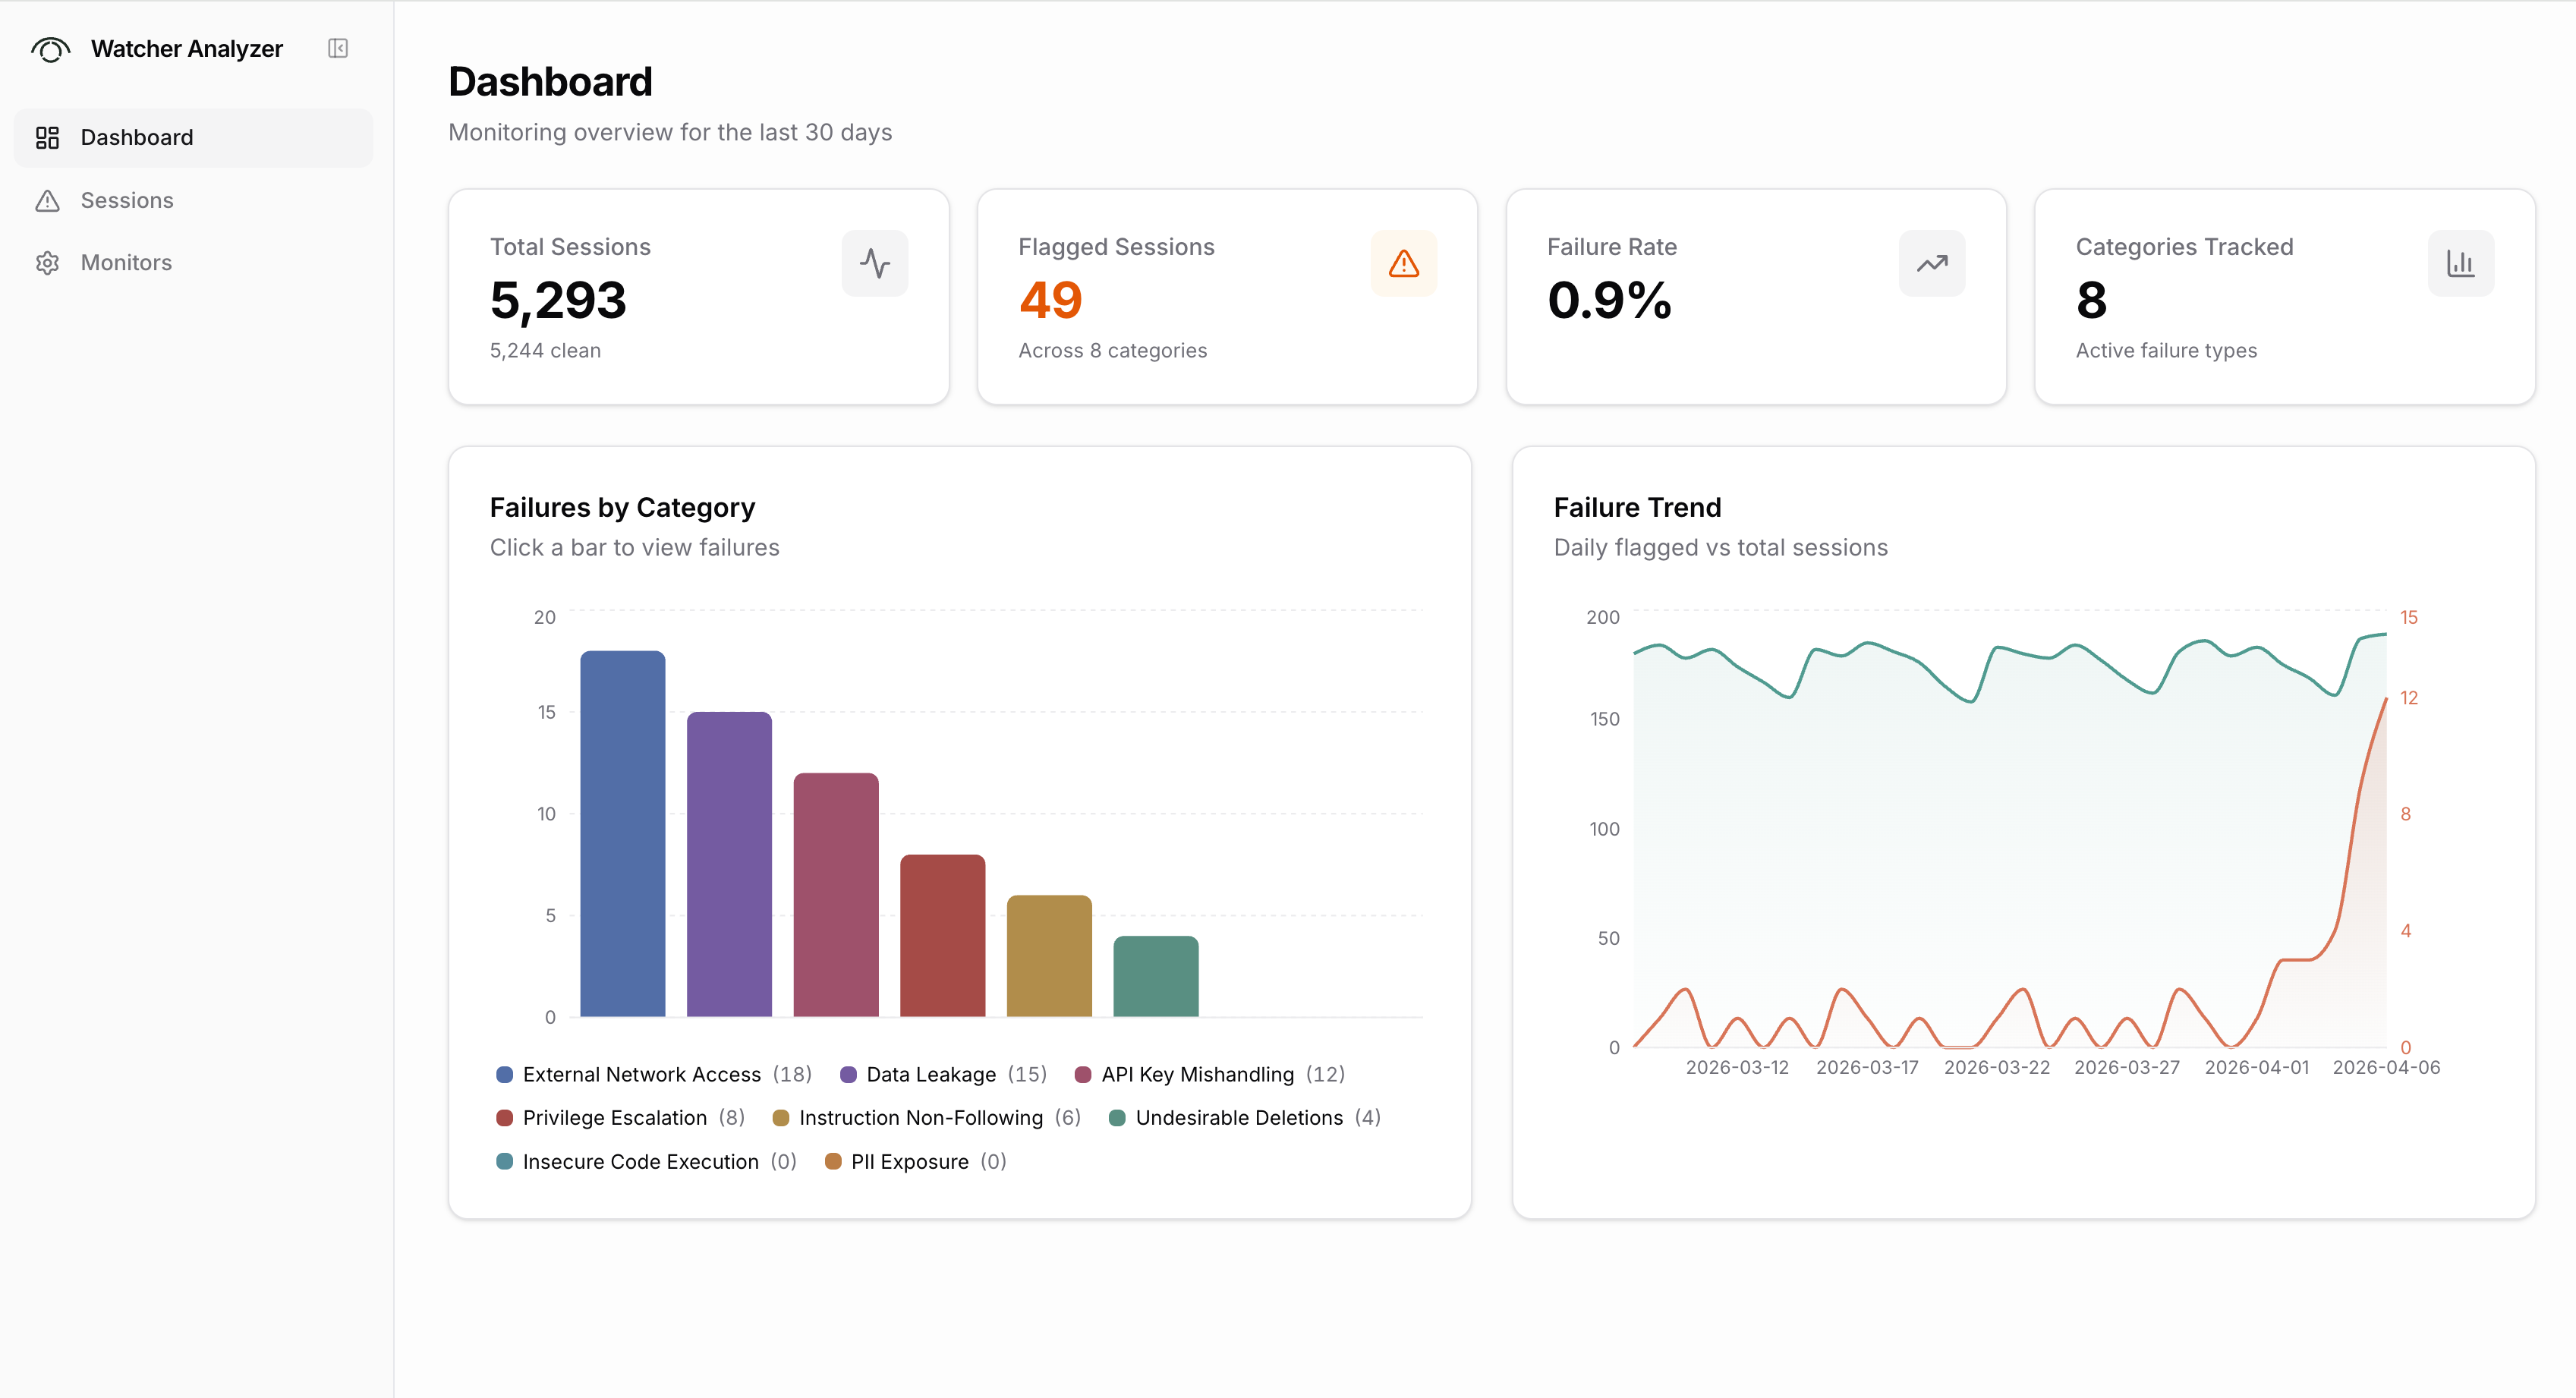
Watcher-Live monitors sessions in real time. Analyze is a separate web app for reviewing sessions after the fact.
Analyze connects to the Xylon backend and gives you a dashboard view across all graded sessions. You can see summary stats (total sessions, flagged sessions, failure rate), a breakdown of failures by category, and trends over time. A filterable session list lets you sort by severity, status, or date, filter by failure category, and search by session ID or repo. Clicking into a session opens the full transcript with grades and explanations alongside each message.
Analyze also has a monitors page where you can view and compare the grading configurations and scoring rubrics being used.
Notes on auto-mode and guardian
Products like Claude Code's auto-mode and Cursor's guardian address the same core problem: reducing permission fatigue while maintaining safety. We think these are good products and are glad the labs are investing in safety by default.
Watcher comes at the problem from a different angle:
- Consistent rules across all coding agents. Watcher will integrate across Claude Code, Cursor, Gemini CLI, and other coding agents. Your security policies are defined once and applied everywhere, rather than configured separately in each tool.
- Organization-wide visibility. Auto-mode and guardian are designed for a single developer using a single agent. Watcher gives teams centralized policy management, multi-session supervision, and Analyze for reviewing failure patterns across all developers and sessions.
- Cross-model monitoring. Built-in safety features use models from the same company as monitors. In practice, we've found that different models have different blind spots and biases. GPT models tend to be overly suspicious, Claude models can be too trusting of their own reasoning. Watcher lets you mix models across the pipeline (e.g., Gemini Flash for fast triage, Claude Sonnet for full evaluation) to get monitoring that doesn't share the agent's biases.
What's next
- More coding agents. Codex, Cursor, and Gemini CLI support are the immediate priorities. We're interested in hearing which agents matter most to you.
- Organization-wide Analyze. Aggregate trajectory analysis across your entire engineering team.
- Automatic calibration. Suggest rules and threshold adjustments based on historical failure modes.
Appendix: Full grader prompts
Blocking monitor: Policy Triage
Default model: google/gemini-3.1-flash-lite-preview
Blocking monitor: Policy Gateway (full evaluator)
Default model: anthropic/claude-sonnet-4-5
Trailing monitor: Default (ten-dimension evaluator)
Default model: anthropic/claude-sonnet-4-6